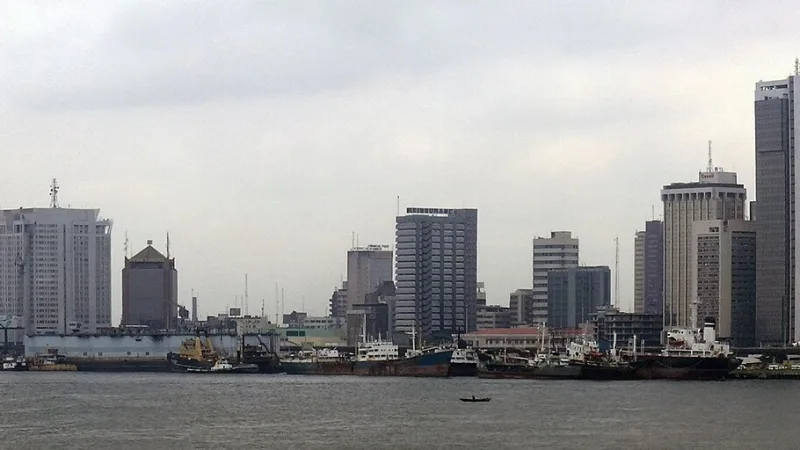
Ranking Africa's stock exchanges sounds like a factual exercise and is actually a methodological one. The figures published by different sources disagree, sometimes substantially, and the disagreements are not errors — they come from genuine choices about what to count and when.
This article explains the structure of African equity markets and why the numbers vary. It gives the broad ordering, which is stable, rather than precise figures, which are not.
The one fact that defines the continent's markets
South Africa's Johannesburg Stock Exchange is not merely the largest African exchange — it is larger than all the others combined, by a wide margin. Published estimates in October 2026 placed the JSE at roughly US$1.4 trillion, against something in the region of US$120 billion for the second-placed Nigerian Exchange. One compilation put the JSE at close to three-quarters of all tracked African market capitalisation.
That concentration is the single most important structural fact here, and it has a consequence worth stating plainly: any statement about "African markets" that is driven by total market capitalisation is largely a statement about South Africa. Pan-African index funds and "Africa ex-South Africa" products exist precisely because of this distortion.
The broad ordering
The tiers below are stable even though the figures within them are not. Positions within a tier shift with prices and currencies; movement between tiers is rare.
| Tier | Exchanges | Approximate scale |
|---|---|---|
| 1 | Johannesburg (JSE), South Africa | Over US$1 trillion |
| 2 | Nigerian Exchange (NGX); Casablanca (Morocco) | Roughly US$100–120 billion each |
| 3 | Egyptian Exchange (EGX); Botswana | Roughly US$70 billion each |
| 4 | BRVM (regional, West Africa); Nairobi (Kenya) | Roughly US$20–35 billion |
| 5 | Ghana (GSE), Tunis, Dar es Salaam, Uganda and others | Smaller national markets |
Note two entries that surprise people. Botswana ranks high relative to its population because of a long-established market and listed financial institutions. The BRVM is a single regional exchange serving eight West African countries from Abidjan — the only exchange of its kind on the continent, and a reminder that national boundaries and market boundaries are not the same.
Why published figures disagree
Four methodological choices account for most of the variance. When two sources differ, one of these is usually why.
Total versus free-float capitalisation
Total capitalisation counts every share in issue, including state holdings and founder stakes that never trade. Free-float counts only shares genuinely available. The gap can be enormous in markets with concentrated ownership, and it changes rankings. See market capitalisation explained.
Cross-listed and foreign-domiciled companies
Several of the JSE's largest constituents are globally operating companies listed in both Johannesburg and London. Whether their full capitalisation is attributed to the JSE materially changes South Africa's figure. The same question arises for mining companies listed in multiple jurisdictions.
The exchange rate used
Converting local-currency capitalisation to dollars requires a rate, and currencies move. A market can appear to shrink 15% in dollar terms while rising in its own currency, purely on the exchange rate. This is why a dated, currency-stated figure is the only kind worth quoting — see comparing African currencies.
The measurement date
Compilations published within weeks of each other often use source data from different months. Comparing a July figure for one market with an October figure for another produces a ranking of nothing.
Market capitalisation to GDP: a more revealing measure
Dividing total market capitalisation by national GDP shows how much of an economy is actually listed and investable. On this measure the ordering changes considerably: South Africa and Botswana score high, while Nigeria scores low relative to the size of its economy — a large economy with a comparatively small listed sector.
For an investor this ratio is often more useful than the absolute figure, because it indicates whether the listed market represents the economy or just a slice of it. A fast-growing economy with a small listed sector offers limited ways to participate in that growth through equities.
Size is not the same as investability
The ranking answers "how big?" It does not answer the questions that determine whether you can actually invest, which are:
- Liquidity. Turnover matters more than capitalisation. A large market where little trades is harder to use than a smaller, more active one.
- Market access. Can a foreign investor open an account, and how straightforward is it?
- Capital repatriation. Can proceeds be converted and taken out, and how quickly?
- Disclosure quality. How reliable and timely are listed company accounts?
- Currency stability. As above — half the return for a cross-border investor.
A market can be large and difficult, or small and straightforward. Our markets overview tracks six African exchanges with live prices, breadth and source timestamps, and the Data Commons offers the underlying boards as downloadable data.
Where to get authoritative figures
For anything you intend to rely on, go to the primary sources rather than a secondary ranking:
- Each exchange's own statistics pages — the JSE, NGX, EGX, Casablanca, NSE and GSE all publish market statistics.
- The African Securities Exchanges Association, which compiles data across member exchanges.
- The World Bank and IMF for market capitalisation as a share of GDP on a consistent methodology.
When citing a figure, state the date, the currency, and whether it is total or free-float. A ranking without that apparatus is a talking point rather than data.
Frequently asked questions
Which is the largest stock exchange in Africa?
The Johannesburg Stock Exchange, by a very wide margin — larger than the rest of the continent's exchanges combined on most published measures.
Where does the Ghana Stock Exchange rank?
Among the smaller national markets by capitalisation. That reflects the size of the listed sector rather than the quality of individual companies, and a small market has the compensating advantage of being possible to understand in full. See GSE versus NGX.
Why do different sources give different rankings?
Free-float versus total capitalisation, treatment of cross-listed companies, the exchange rate used, and the measurement date. All four are legitimate choices that produce different answers.
In short
The JSE dominates to a degree that distorts every continental aggregate. Below it, Nigeria and Casablanca, then Egypt and Botswana, then the regional BRVM and Nairobi, then the smaller national markets including Ghana. Treat the tiers as reliable and the figures as snapshots — and when it matters, get the number from the exchange itself with a date attached.